

Are crime maps holding back North Minneapolis?

Are crime maps holding back North Minneapolis?
Minneapolis Police provide this data, and much more, like shots fired calls, free to download from the city’s website, but are data maps de-incentivizing investment in north Minneapolis? FOX 9 Investigators takes a look.
MINNEAPOLIS (FOX 9) - Esther Adams feels relatively safe in the North Minneapolis home she has lived in for 50 years. Until she saw the map, that looked familiar, like another map she had seen long ago.
"You’re telling this is a new map?" asked Adams. "Because I thought this was the old map."
The map is a crime risk map produced by CoreLogic, a California-based company that provides risk analysis for retailers, insurance companies, and insurance underwriters, by culling crime data from 18,000 police departments in the United States.
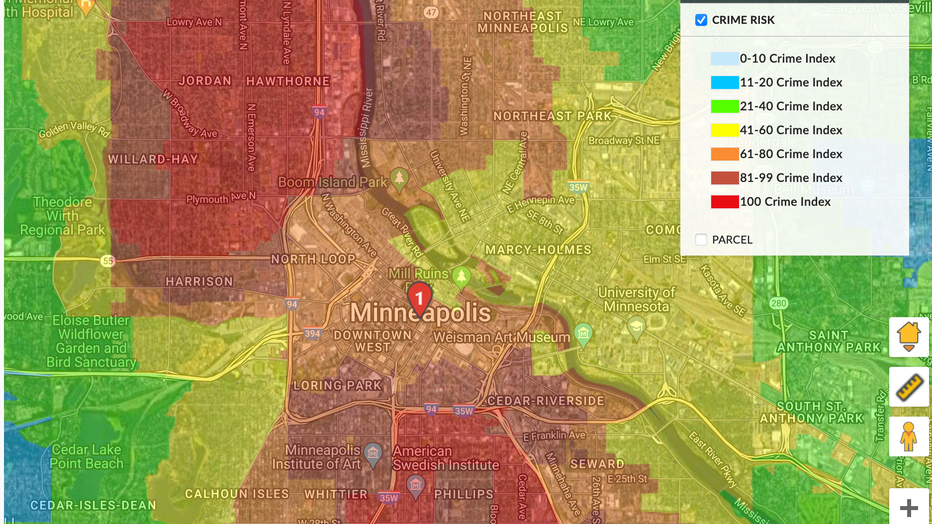
A Risk Meter map of North Minneapolis from California based CoreLogic. Red indicates crime in the area is up to five times the national average. (CoreLogic)
Red all over
CoreLogic’s map for North Minneapolis shows an enormous swath of red from Golden Valley Road to the south, spanning the length of seven neighborhoods: Near North, Willard-Hay, Jordan, Hawthorne, Folwell, McKinley, and Camden.
Nearly the entire northwest side of the city is saturated in crimson red.
CoreLogic says the red zone means the area has up to five times the national average for property and violent crime.
Adams, who lives in the Willard-Hay neighborhood, thought it looked like the old redlining map she saw when she moved into her home in 1972.
"When we moved here, they said that there was a lot of redlining," she said.
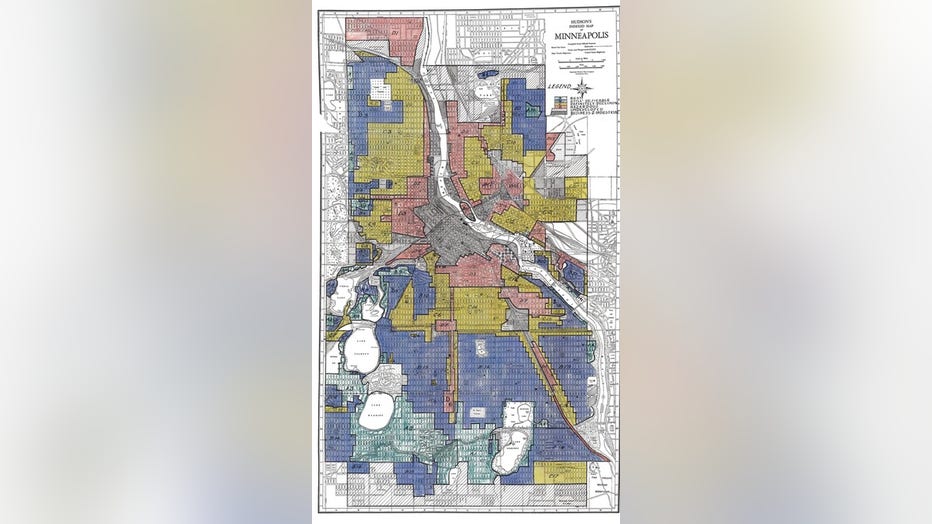
An old redlining map of Minneapolis used by the Home Owners' Loan Corporation (HOLC). Red indicated the area was 'hazardous' for investment. (National Archives)
Stores Leaving North
She, like others interviewed by the FOX 9 Investigators, wonders if crime mapping has also played a role in Adam’s favorite retailers recently leaving the North Side.
Her pharmacy, the Walgreens on West Broadway, is permanently closed, the company blaming, among other things, "dynamics in the local market."
The Aldi market, at Penn and Lowry Avenues, packed it in too, saying they couldn’t expand, and their lease was expiring, although the landlord told FOX 9 Aldi was offered additional space.
It’s not just a phenomenon in the Twin Cities. In urban areas across the country, major retailers are retreating from areas perceived as plagued by crime.
San Francisco is witnessing a retail exodus, with Walgreens closing five stores, Nordstrom, Whole Foods, and several big box stores are getting out the downtown area as well.
Recently, Walgreens CEO admitted in an earnings call that the company may have overreacted to crime reports in shuttering its stores.
Crime as data
Besides having enormous social costs, crime also becomes data, with every carjacking, robbery, assault, or homicide, becoming a separate data point.
Minneapolis Police provide this data, and much more, like shots fired calls, free to download from the city’s website. To protect crime victims, most Minneapolis Police data is geolocated in the middle of a block.
CoreLogic says it uses "120 proprietary models" to crunch the numbers for its risk meter.
It also gives Las Vegas-like odds of becoming a crime victim at a particular address.
Kristel Porter, director of the West Broadway Business and Area Coalition, wonders if the red zone explains why there are so many empty storefronts.
"So why is it that people cannot get funding to open up a business in North Minneapolis?" Porter asked.
"Probably because of that map. I would be scared away too if I wasn't from here," Porter said.
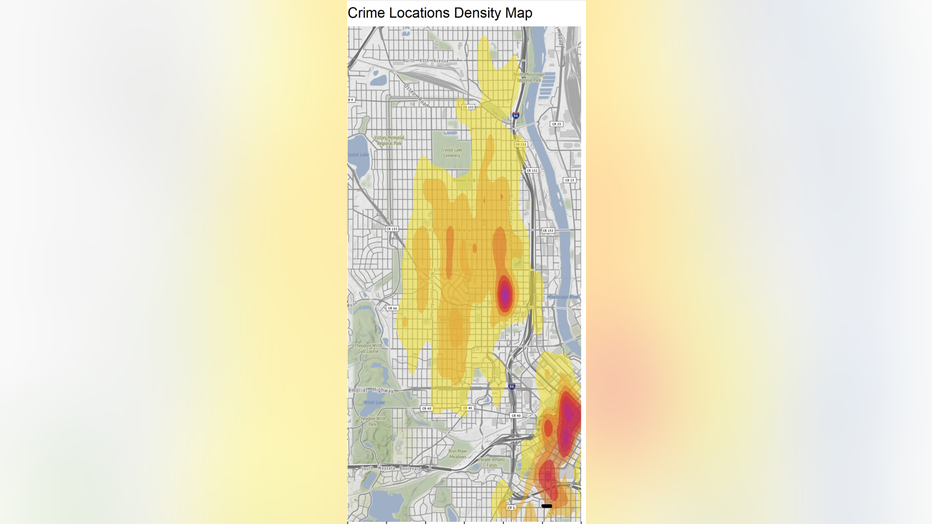
A crime density map using Minneapolis Police crime data from 2019-2022 showing the concentration of crime in more geographically specific areas. (Assistant Professor Claire Kelling, Carleton College)
A big red flag
Gayle Smaller, who sits on the Northside Residents Redevelopment Council (NRRC), said the CoreLogic map may explain some of what is happening with the slow pace of economic recovery in North Minneapolis.
"There's a big red flag saying don't go there, or you're not going to make any money, you're going to get robbed, your insurance is going to be through the roof. From a business perspective, why would you take that risk?" Smaller said.
The CoreLogic data, purchased by the FOX 9 Investigators, shows much smaller red zones in South Minneapolis, covering Ventura Village, Phillips and East Phillips. There are no red zones in St. Paul.
Dean Rose, the owner of Broadway Liquors, believes the data paints the neighborhoods on the North Side with too broad a brushstroke.
"It looks like it’s generalizing the entire area, that the entire community of North Minneapolis is onerous, and crime-ridden, which actually isn’t the case," Rose said.
According to the City of Minneapolis crime data dashboard, violent crime on the North Side is down in several categories.
Year to date, assault is down 8 percent, theft is down 18 percent, and shots fired calls are down a dramatic 31 percent. The number of recorded gunshot victims is down 8 percent.
And yet, those trend lines may matter little to developers and retailers if a map is reinforcing a certain perception of crime.
"And quite honestly, over the decades we've been trying to recruit businesses to West Broadway. Frequently, the national chains and the businesses that have a presence throughout the country look at our area and say, we're not coming there," Rose said.
Rose believes the problems got worse after the civil unrest in 2020.
His liquor store was looted, and he had to close for two months.
Afterward, his insurance rates doubled, and he had to get policies from seven different providers to cover his businesses and an attached affordable housing development.
According to data from the Minnesota Department of Commerce, insurers paid out $316 million dollars in claims from the 2020 civil unrest, the vast majority for commercial property.
More than $44 million in claims were paid out in the 55411 zip code of North Minneapolis.
Crime as ‘risk management’
Mark Kulda, of the Insurance Federation of Minnesota, said the analysis of crime, like the risk of severe weather, fire, or other events, is the nature of managing risk.
"Especially commercial insurance, it is a very highly competitive marketplace, and you can have two different insurers that treat crime data completely differently," he said.
Kulda said most chain retailers are self-insured up to a certain threshold of loss, but crime data could play a bigger role with small retailers or sole proprietors.
"If you’re in an area that’s high risk, the insurer may say, look, in this neighborhood the risk of paying further claims is very high, so a business owner may have to pay a commensurate premium with that, which means it's going to be more than a business that's in a safer area might have to pay," Kulda said.
Kulda said there are other options for insurance, including an unregulated secondary market and the Minnesota FAIR plan, which is a pool for higher-risk policies funded by the insurance industry.
Those options usually come with higher premiums.
A history of redlining
Gayle Smaller of NRRC sees a legacy of inequality in the CoreLogic map.
"For the last 15 years, I've been telling everyone this map exists. Just from being an observer of the community, being born and raised here, I knew that there was something that existed that was stopping companies from coming here," Smaller said.
In 1933, as part of the New Deal, Congress created the Home Owner’s Loan Corporation (HOLC) to refinance mortgages and prevent foreclosures.
HOLC created "residential security maps" and developed a classification system for urban areas. Property in red areas on a map were considered "hazardous" for investment.
Areas in green were considered the best for investment. In Minneapolis, those green areas tended to be in neighborhoods with racially restrictive covenants included in the home’s deed.
The HOLC maps, and others like them, were used in banking and real estate for decades, until their use was outlawed in Minnesota and the U.S. in the late 1960s.
You can still see the legacy of those maps today, critics say, in maps reflecting the distribution of socio-economic status, race, home values, and homeownership.
Those old redlining maps include most of the same areas now in red because of higher crime rates.
CoreLogic Responds
In a ‘redlining statement’ featured on its website, CoreLogic says it "never uses any personal characteristics associated with race, color, religion, national origin, or citizenship."
CoreLogic declined an interview but in response to questions from the FOX 9 Investigators, said in statement its "proprietary data science methodology" uses "the most recent, up-to-date ‘Final, Non-Preliminary’ data available for our analyses rather than basing our research on preliminary data that may be outdated or inaccurate."
"CoreLogic never uses any personal characteristics associated with individuals commonly defines as a prohibited basis or protected class," the statement said.
CoreLogic also provides data for the MLS realtor listings in the Twin Cities.
In its statement, CoreLogic said it does not use data on "household/neighborhood income, household/neighborhood demographics, or real estate listings or sales activity for its crime risk analytics."
‘Fairness through unawareness’
Assistant Professor Claire Kelling of Carleton College studies crime data and spatial statistics and had concerns with the CoreLogic map of North Minneapolis.
"It's just so striking to me that this map is not telling the full story," Kelling said.
She worries about biases that can get baked into so-called "black box algorithms," and said it is not enough to simply exclude race and ethnicity data because racial bias can reveal itself in more subtle and nuanced ways.
Kelling said the research problem is known as ‘fairness through unawareness,’ when so-called protected variables like race maybe become correlated with other variables because of complex social factors.
"When I first saw those maps, I just saw this one color for that whole community. And it was really striking to me compared to the policing data that I've been working with in that area as well," Kelling noted.
Her research shows both property and violent crime in North Minneapolis is concentrated in a much smaller area of Near North. In fact, her mapping analysis shows crime is more densely concentrated in Downtown Minneapolis than it is in North Minneapolis.
North Minneapolis also has a history of over-policing, critics say, that can artificially inflate crime data, with saturation patrols like the recent Operation Endeavor. More arrests equal more data.
Kelling also worries the CoreLogic data is not as precise as some may believe, because Minneapolis Police data is geo-located in the middle of the block, to provide a level of anonymity for crime victims.
Researchers like Kelling, who study crime and its location, have also determined that most crime is not spread across residential neighborhoods, but occurs in very specific locations, known in the research as ‘Micro-Places.’
The Walgreens on West Broadway is one of those ‘Micro-Places.’
In the last three years, there were hundreds of police calls for shoplifting, assault, and theft. Last year, a man was shot inside the store and critically injured.
Porter, of the West Broadway Business Coalition, believes it is fundamentally an urban design problem.
There is a liquor store across the street, and several nearby social service providers pulling outsiders and problems into the area, she said.
"You can’t be surprised when you have a bunch of crap happening in that area," Porter said.
Full CoreLogic statement
CoreLogic collects raw crime data covering more than 18,000 law enforcement agencies in the United States and attributes the reported crimes to local communities after analysis performed using a proprietary data science methodology. We analyze the most recent, up-to-date "Final, Non-Preliminary" data available for our analyses rather than basing our research on preliminary data that may be outdated or inaccurate. CoreLogic never uses personal characteristics of any kind for its crime risk analytics, including personal characteristics commonly defined as a prohibited basis or protected class (race, color, religion, national origin or citizenship status, sex or gender identity/expression, marital or familiar status, age, income, credit or public assistance, handicap or disability or mental capabilities, pregnancy, genetic information, military or veteran status). In addition, CoreLogic does not use data based on household/neighborhood income, household/neighborhood demographics, or real estate listings and sales activity for its crime risk analytics. For more information, please visit https://help.neighborhoodscout.com/support/solutions/25000014360