

Minnesota weather: Here's what could be in store over the summer

Thursday's forecast: Clouds linger through most of the day, highs around 70
Friday will be sunny with highs in the mid 70s!
(FOX 9) - After a below-average winter and a spring that felt like it took forever to get here, it could be a very warm summer. While nothing in the world of weather is a guarantee, we can look back at what happened in previous years to get an idea of what is most likely to happen this year.
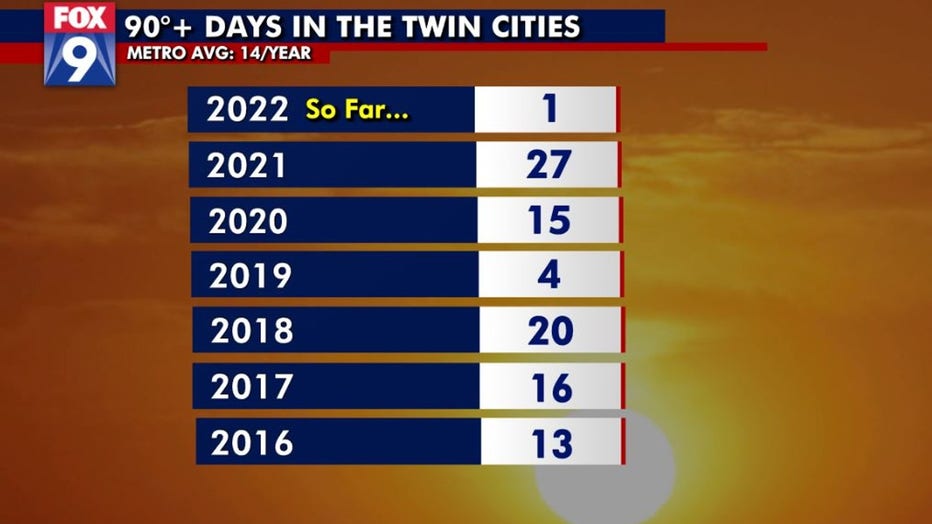
The number of 90 degree days in the Twin Cities in recent years. (FOX 9)
As we all know, predicting the future is not an exact science. And the farther into the future the prediction, the more difficult it becomes. So much so, that even a forecast a week away can be a bit like throwing darts. So if it's a roll of the dice for the next seven days, how can we accurately predict an entire season's worth of weather? Well, the simple answer is we can't. But it doesn't mean we can't look to see what is most likely to happen.
Full disclosure here, I'm a meteorologist, not a climatologist. That means I'm an expert in what's considered to be "short-term" weather. While that definition can fluctuate depending on who you ask, I would say most would consider that to be up to 14 days. Climatology is "long-term" weather that can encompass weeks, months, years, or even decades. But it's these overall patterns that can give us a clue into what could potentially show up down the pipe.
On Earth, everything goes in cycles. There are long-duration cycles, the medieval warm period that lasted roughly 300 years, is one example. Another one would be an ice age, with some of those lasting thousands of years. We also have short-duration cycles, like it raining every Tuesday for a few weeks in a row. But of course, then we have some that are in between. These can last months, years, or even decades —and all play a role in both long-term and short-term weather patterns. But most of these "in-between" weather patterns are NOT actually controlled by anything IN our atmosphere. Most are the result of ocean currents.
The surface of our planet is made up of roughly 70% water. Water heats and cools at a different pace than land and air. And because of the rotation of the Earth, that water also moves. We call these movements ocean currents. Well, with something taking up so much of our surface, it stands to reason that it would have a profound effect on our atmosphere as well. Scientists are just beginning to understand how our ocean currents play a role in our weather, so we have just breached the surface (pun intended) in our overall knowledge of whatever is happening. But we do know a few things about these currents and what they potentially do to our weather.
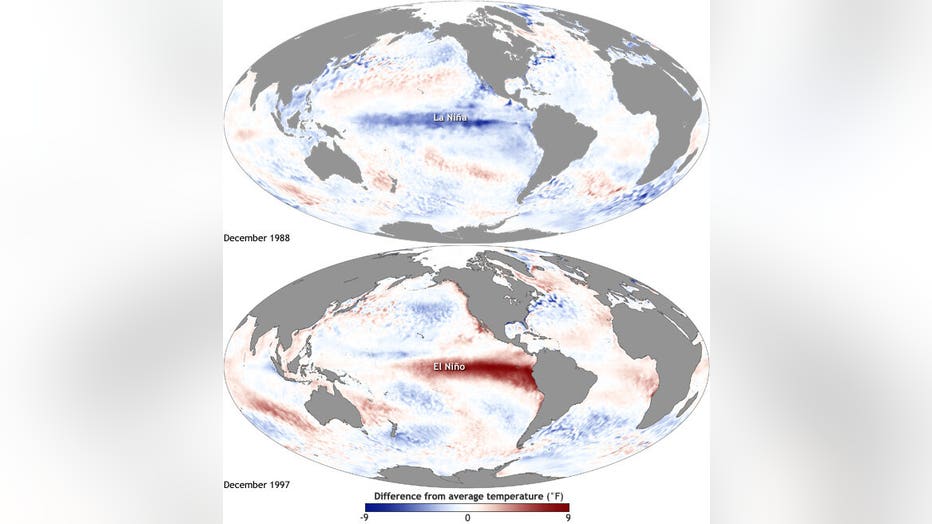
El Niño/La Niña ocean cycle. This refers to one specific section of that large body of water near the equator (FOX 9)
The most commonly known ocean cycle is El Niño/La Niña, often referred to as the El Niño Southern Oscillation or ENSO. This is the result of winds along the equator going in generally the same direction through the course of the year. In the continental United States, we call these persistent winds, the westerlies. That means our weather generally comes from the west. Near the equator, it's generally the easterlies. The easterly winds push water to the west, in the general direction of Malaysia, South Korea, and Australia. While this is the natural state of things, eventually you get a buildup of water on the western side of the Pacific Ocean that these breezes can no longer support. When this happens, the Pacific Ocean "sloshes" — a lot like what would happen if you push all the water to one side of a bathtub with your arm. Eventually, that water will slosh back. This sloshing effect influences the surface temps of the Pacific Ocean near the equator and therefore has a large impact on the atmosphere in the Pacific, which then can, directly and indirectly, affect areas all over the globe.
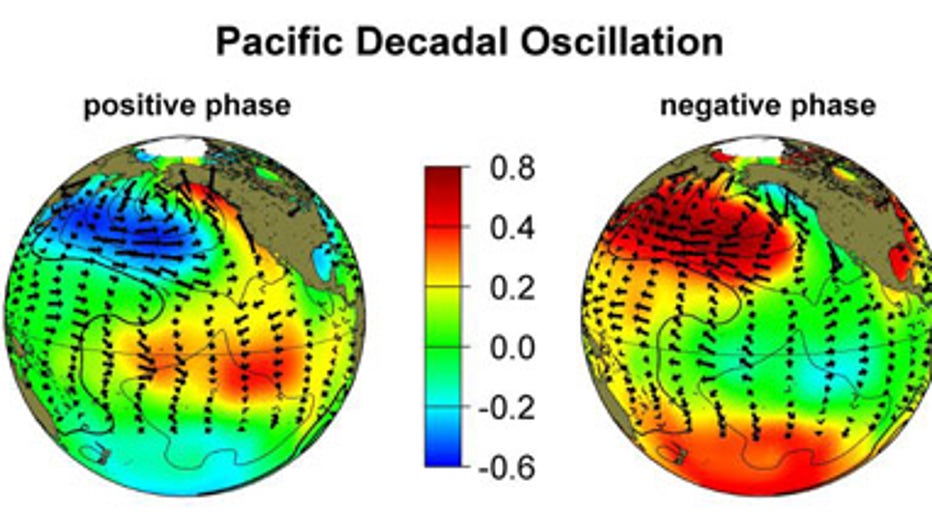
Pacific Decadal Oscillation sea cycle. It encompasses the entire Pacific Ocean. (FOX 9)
A lesser-known sea cycle is called the Pacific Decadal Oscillation or PDO. This is also a part of the overall Pacific Ocean pattern. It has to do with warm and cold cycles of the ocean, but on a much broader scale. The entire Pacific Ocean has warm and cold cycles for which the PDO accounts. The ENSO just refers to one specific section of that large body of water near the equator. Think of it like just a small piece of a much larger puzzle. ENSO is also commonly a shorter-term pattern in the grand scale of Earth phenomena. It usually lasts a few months or a year or two at a time. But the PDO encompassing all the Pacific Ocean and a much larger area, often lasts several years or more — and can stretch to several decades at a time as the name would suggest. How it exactly works and why it can fluctuate on such a broad scale, remains elusive. But we know that it can have broad impacts on our weather over long periods of time.
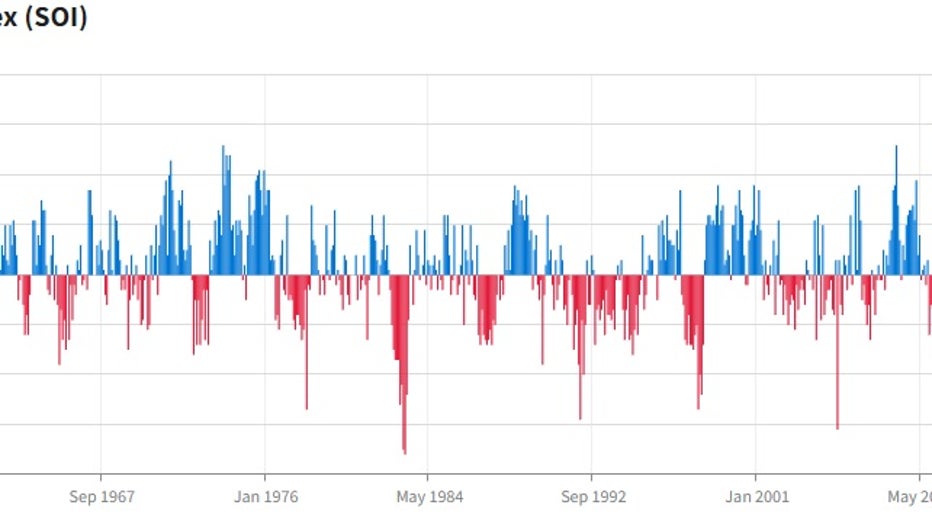
So how does all of this relate back to forecasting what will happen over the summer? Well, these ocean patterns are tracked on an index based on their intensity and duration. Reliable records date back to the early 1950s. The state of these indexes is calculated each month and added to the charts you can view below allowing us to see an easy glimpse into what has happened over the last several decades. Using these observations and comparing them to what occurred across the U.S. during those periods, we can get a glimpse of how these oscillations can affect our weather and then make predictions based on what has happened in the past during these specific phases and cycles.
PDO chart.
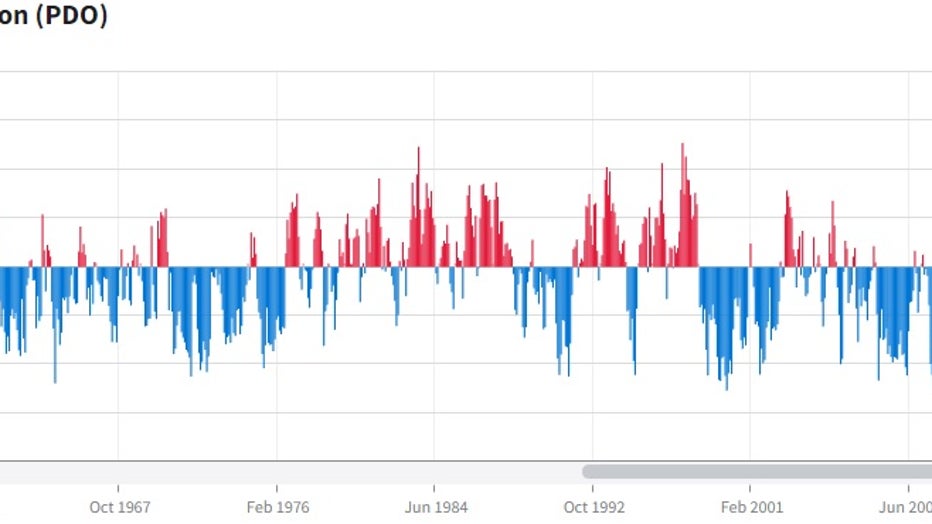
PDO chart. (FOX 9)
The most recent observations were in April when the PDO was in the strongest cold phase in more than a decade. ENSO is in a positive phase, called La Niña, also in the strongest phase in more than a decade. So if you take these indices and find when both were in similar phases and intensities, you may find a pattern with what will happen over in the few months post-observation. That would narrow our search down to the years 2011, 1999, and 1956.
Using NOAA's (National Oceanic and Atmospheric Administration) climate reanalyzer, we can create a composite of what happened with temperatures and precipitation when compared to average over those three years. And here is what we found:
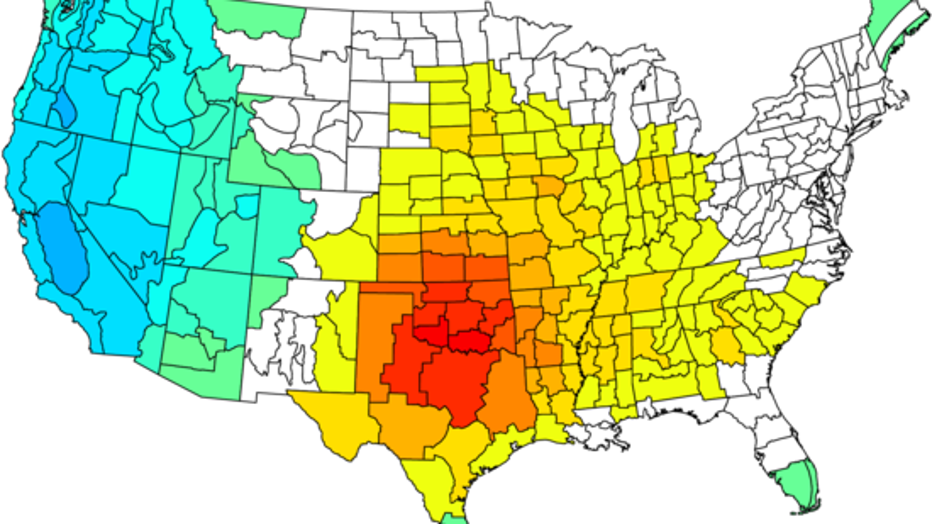
A composite of temperatures during the summers of 1956, 1999 and 2011. (FOX 9)
Temperatures were above average in the central and southern U.S. Well above average in the southern plains. But then cooler than average across the west and very small parts of the east.
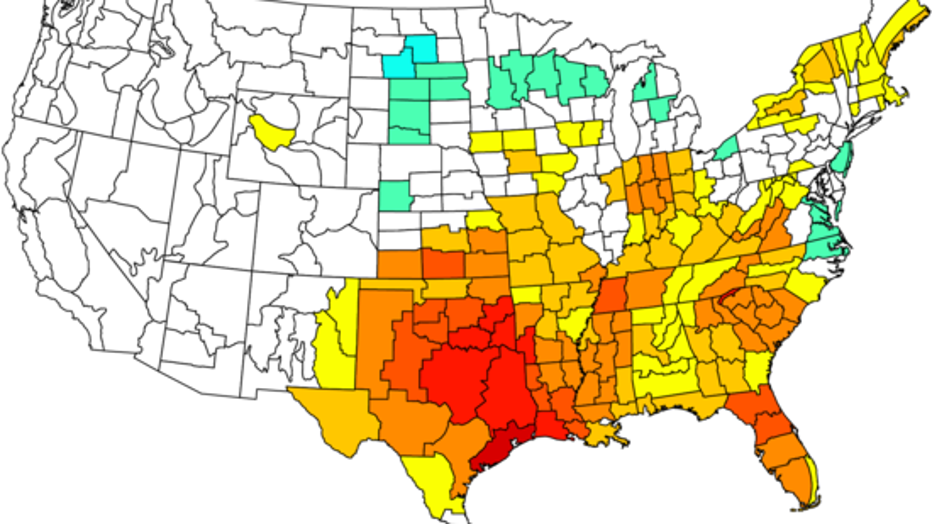
A composite of precipitation during the summers of 1956, 1999 and 2011. (FOX 9)
As for precipitation, much of the southern and eastern U.S. ends up below average with parts of the upper Midwest and Great Lakes a little above average, and the west near normal. Both of these point to a classic heat dome scenario, where a large and stagnant area of high pressure builds into the southern U.S. leading to widespread sunshine, dry, and very hot conditions for the southern and central U.S. But on the periphery of that dome across the north, scattered storms erupt on a routine basis that would lead to slightly wetter than average conditions.
Now, this absolutely does not mean that this exact scenario will happen. It could be something wildly different because of other unforeseen variables — there are likely hundreds of these variables lurking in the atmosphere. But when comparing our current Pacific Ocean currents to years past, this may be the most likely scenario.
However, when drawing a scientific solution, the more data the better. And this is a very small sample size of only three years. To get more data involved though, we can broaden our scope a little bit and include years that have an ENSO and PDO that's closely resembling this year's setup, but may be a little off. Then we can include a few more years that may give us a better idea of the overall average for what's ahead in June, July, and August.
Recent similar years include 2011, 2009, 2008, 2006, 2001, 1999, 1991, and 1990. Adding this to the previous 3 years we've already used, and it gives us a much larger sample size.
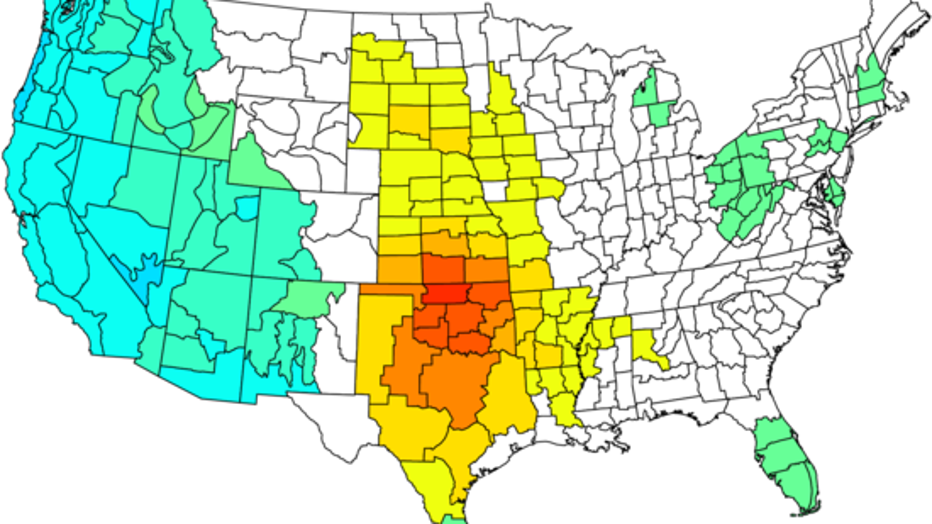
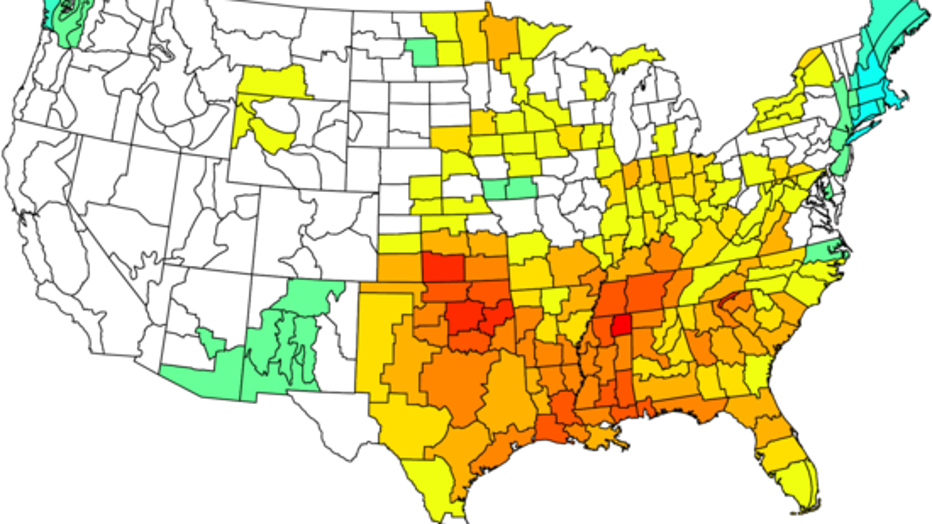
A composite of temperatures during several summers, which suggest Minnesota could see warmer-than-average temps this summer. (FOX 9)
In these years, there are certainly some similarities with above-average temperatures in the central states and a colder than average west. The biggest change for temps appears to be an expansion of the warmer than average temps into much of Minnesota.
A composite of precipitation during several summers. This suggests the upper Midwest could see another dry summer similar to 2021. (FOX 9)
Some similarities for precipitation as well, but certainly one glaring difference. Adding these "fringe" years leads to well below-average rainfall expanding across much of the upper Midwest. This would set the stage for another hot and dry summer, something potentially similar to last year.
So what can we conclude from all of this? Well, we appear to have a higher likelihood of having a warmer-than-average summer with our indices leaning toward a "heat dome" scenario. But when it comes to precipitation, our comparison years vary wildly with a lack of consistency for any such situation. This means that we can't really lean one way or another. However, if temperatures head in an above-average direction, the more intense heat has a better opportunity to dry up the soil which would lead to an expansion of drought once again without some consistent rain. But we'll just have to wait and see.