

What are these line plots I keep seeing?
KMSP - All the buzz on the internet lately has been with both former hurricane Harvey and now Irma. It makes sense considering Harvey will likely go down as the costliest natural disaster in US history… well now Irma may take that title depending on where it goes and how strong it is. So the question of where these monsters will go is always at the top of everybody’s mind, but trying to figure that out unfortunately takes more than a smile. While meteorologists can use the basic principles of physics and atmospheric dynamics, the Earth and its thin atmosphere are far more complicated that anything a human brain can comprehend. So we rely on supercomputers to do much of the thinking for us. A host of current conditions are measured all over the world to get the best “snapshot” of the atmosphere as possible. In fact, even the National Weather Service office in the Twin Cities is helping with the forecasting of Irma… you can see how here… http://www.fox9.com/weather/extra-weather-balloon-launches-in-minnesota-to-help-track-hurricane-irma
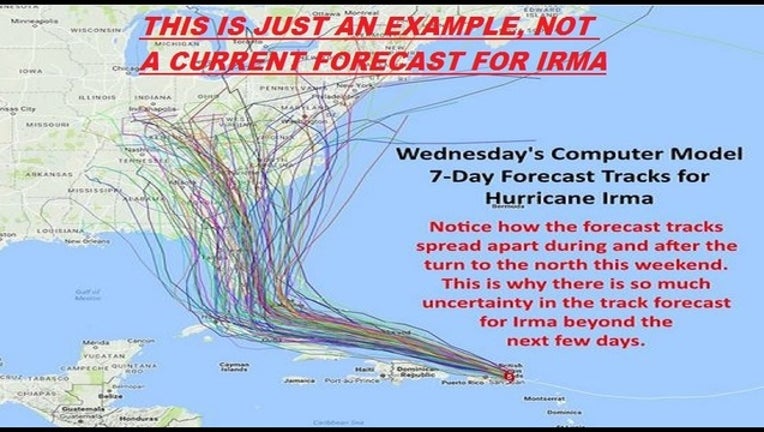
These current conditions are thrown into dozens of weather computer models and then they pop out a solution, aka a forecast, for the next few days. But just like human beings, every one of these supercomputers has a different “opinion” of where the storm will end up. This is where these “spaghetti plots” come in.
Pictures like the one above have been floating all around the internet on Irma, and before that, on Harvey. But what do they really mean? Many of these are a compilation of all of the computer models’ solution on where the eye, or center of circulation, will go over the next numbers of hours or days. Each computer takes in current conditions and then projects where these storms may end up based on the trillions of processes that have been programed into them. So which one is right?
That’s always the hard part for many to understand. One of them may be right, or none of them maybe right… or it may be a combination of several that end up being correct. This is where the uncertainty lies and why there is never any certainty on exact location of landfall… too many different processes in the atmosphere at any given time to account for every possible outcome. So, these supercomputers make their best guess. Now, this is where a trained meteorologist comes in. After a while, we can interpret how the forecast models are handling the storm and can often pinpoint which one is more likely forecasting the expected path. This is where the Euro model versus the GFS American model have come in over the last several years, made mainstream when hurricane Sandy made landfall in the Northeast several years ago. Right now, the Euro once again seems to be slightly outperforming the GFS, although they are pretty close. But with a storm of this magnitude, even a slight shift of a few miles in one direction or another at landfall, can mean the difference between one area getting 70mph or 150mph… yeah, it can be that drastic!