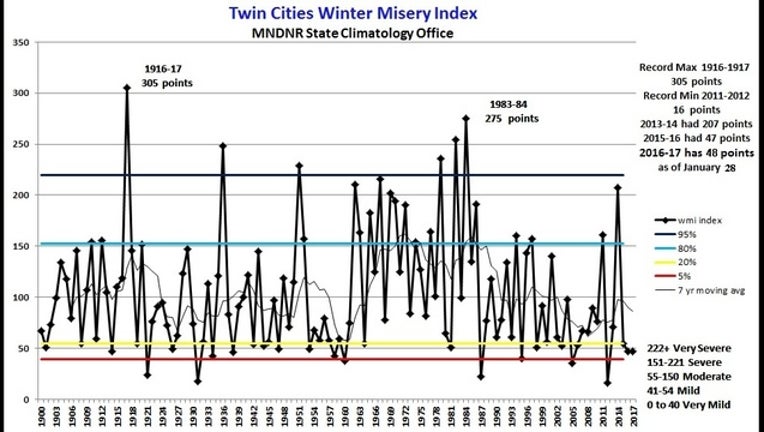
MNDNR Misery Index points to a mild winter… so far

The first Winter Misery Index has been published by the Minnesota Department of Natural Resources and it shows that it has been a pretty tolerable winter so far… although it’s already been more “miserable” than last winter.
The Winter Misery Index (WMI) is a very simplistic attempt to weigh the relative severity of our current winter when compared with winters of the past. The WMI assigns points to a few different winter thresholds dealing with temperature and snowfall and assigns them points. The more points in a winter, the colder and snowier the winter is, the more “miserable” it has become.
1 point is assigned for a daily maximum temperature of 10 degrees Fahrenheit or colder, and a daily minimum of 0 degrees or colder at MSP Airport, the official climate site of the Twin Cities. If the minimum temperature drops to -20 degrees or colder, eight points are attributed to that day. Snowfall totals of one inch or greater in a day receive one point. Four-inch snowfalls generate four points for the day; an eight-inch snowfall receives a whopping 16 points. The duration of a winter is quantified using the number of days the snow depth is 12 inches or greater.
As of January 29, 2017 the WMI for the 2016-17 winter is at 48 points: 23 points for cold, 25 points for snow. This is enough for this winter to be in the "mild" category… or in the bottom 20% of miserable winters (AKA, a mild winter). Eight more points are needed for this winter to be categorized as "moderate” or in the middle 50% of all winters… basically a pretty average winter.
The WMI for last year’s winter, 2015-16, was 47 points, enough for the cold season to be categorized as a "mild". The most “miserable” winter in recent years was the wicked year of 2013-14, where the Twin Cities tallied 207 points, the most since the mid-1980s. Amazingly, just 2 winters earlier, the WMI score was just 16.
Admittedly, this is a VERY simplistic way at comparing our winters. There is certainly some flaw in an index that labels -19° as one point, but gives -20° eight points. Say you get five -19° mornings in a row. That’s just five points. But if those days hit -20°, then all of a sudden that’s forty points. A HUGE difference in overall point value. But again, this tally is supposed to be rudimentary.
A more accurate representation of our winters is produced in a very similar way by the Midwestern Regional Climate Center for cities all across the country including the Twin Cities. It’s called the Accumulated Winter Season Severity Index (AWSSI). It combines dozens of variables from temperature to snowfall & snow cover. I’ll have a future blog on this index later in the winter.

