

Twin Cities yearly precipitation tops 40” for just the 3rd time since 1872
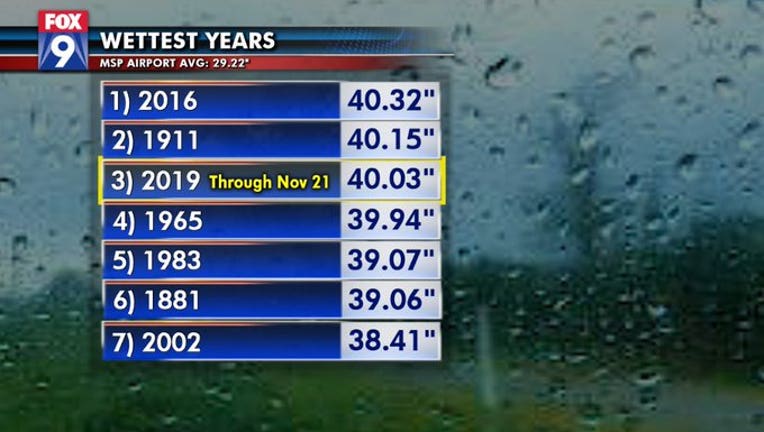
It was the 10th day so far in November where measurable precipitation has fallen. This time, nearly a half inch of rain with a touch of snow at the tail end. But it was also the storm that pushed us over the edge. For just the third time in nearly a century and a half, the Twin Cities has recorded more than 40 inches of liquid precipitation (which includes melted snow). What might be even more amazing though is that this is the 2nd time in the last 5 years we’ve completed that feat, with the previous record coming in 1911.
While the Twin Cities has now officially seen over 40 inches, parts of Minnesota have seen a LOT more. Look at Rochester in southeastern Minnesota.
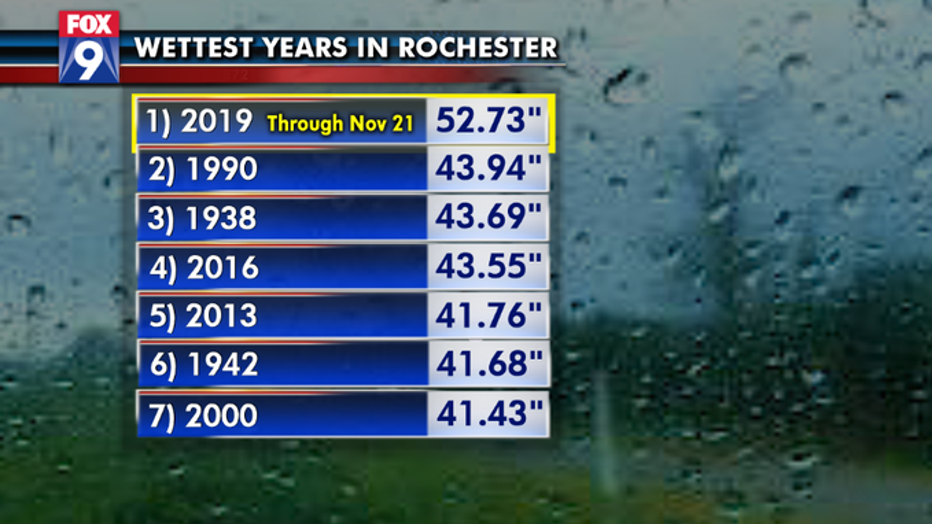
Overall reliable climate records don’t go back as far in Rochester, and there are a few missing years since the early 1900s, but this stat is utterly ridiculous. The city is smashing the old record wettest year by nearly 10 inches. That is absolutely incredible!
So why the big difference from the Twin Cities to Rochester? Well the bullseye for heavy rain and late season snow was southeastern Minnesota with the brunt occurring around the Rochester area. This sent areas rivers over their banks on several different occasions. The Twin Cities only got a glancing blow from many of these heavy precipitation events, and missed a few summertime events altogether.
So why the wet years lately? Well, Mother Nature goes through patterns. The Dust Bowl is just one example of said patterns. While part of it was created by man not understanding the full scope of large-scale farming, the dry and hot conditions for a solid decade is an example of a long-term pattern that Mother Nature can produce. The really cold and snowy 70s and early 80s is another such pattern. Well, much of the central U.S. appears to be in a very wet pattern with exceedingly wet years occurring over the last decade or so. In fact, 14 of the last 20 years, the Twin Cities has seen above average precipitation. Of those years, 6 have come in more than 5 inches above average. Does this pattern continue in 2020? We’ll see…